Geotorget product support
Contents of this page may be automatically translated, we take no responsibility for the accuracy of the translation. Feel free to contact our customer support centre if you have any questions.
Elevation model download is similar in many ways Elevation model display, but provides significantly more options. The guide describes how to connect to the service with WCS in QGIS, visualize the height model and show a concrete example of how to create height curves.
Through the WCS (Web Coverage Service) interface, you get access to the actual height information and thus have unlimited possibilities to visualize and analyze the information.
Connect to the service
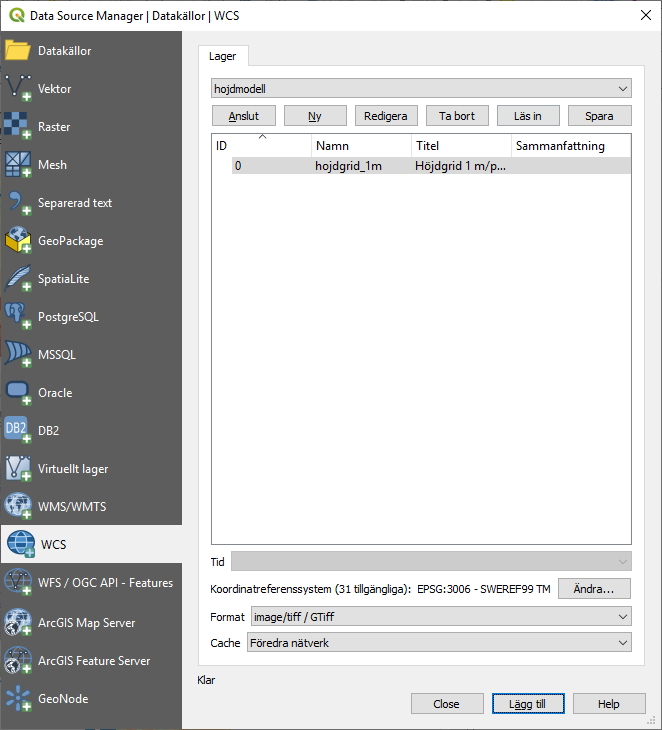
- Open Data Sources in QGIS 3 and select the WCS tab.
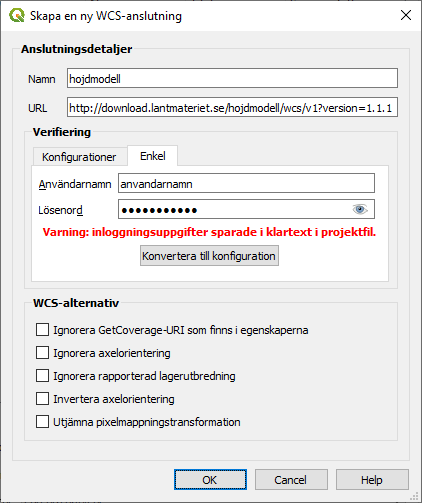
- Tap New and enter the connection information. The correct URL can be found in the document Technical description at Elevation Model Download Product page . QGIS does not currently support WCS version 2, but you must select a URL for one of the earlier versions. Please note that access to the service requires a valid username and password.
- After creating the connection, you can press Connect and the only available map layer hojdgrid_1m is listed, select the layer, select the correct coordinate system (for example SWREF 99 TM), and add the layer to the map with Add.
Visualize the elevation model
The map layer hojdgrid_1m is now used just like any raster layer. The biggest difference is that no pyramids are needed because the service automatically delivers a suitable resolution based on the scale of the map window.
However, there is no way in QGIS to check or control the current resolution, other than zooming in so far that you is guaranteed to have reached the highest available resolution of 1 m.
Change the height model symbology
QGIS displays the height model in a grayscale by default, but under layer properties you can set any symbology (grayscale, color scale or terrain shading).
To easily stretch the selected gray or color scale to fit the current map section, you can use the Raster toolbar. If the toolbar is not visible, select View> Toolbar> Raster tool. After zooming in, you can now press the first button to quickly optimize the scale.

Example: creating elevation curves
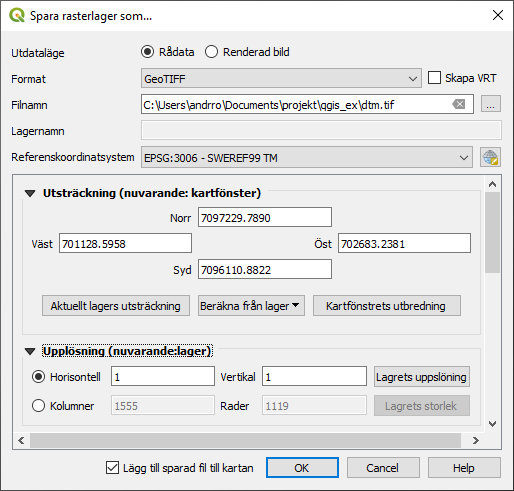
QGIS seems to have difficulty directly analyzing the elevation model as WCS. Therefore, it is best to save a snippet to file first:
- Zoom in on an area of interest
- Right-click on the map layer hojdgrid_1m and select Export> Save As… Select an appropriate file format, a suitable file name and the correct coordinate system. Touch the width of the Map window to save only the current section. Choose a resolution of 1 m that is the maximum of the service, and press OK to save and add as a new map layer.
Generalize the height curves
In this example we want to create height curves with 5 m equidistance and a reasonable degree of generalization. If you create elevation curves directly from a high-resolution terrain model, however, the curves in flat terrain become far too detailed.
An easy way to generalize the curves is to first reduce the model's resolution. You could have set a lower resolution already in the previous step, but that limits the possibilities.
Therefore choose:
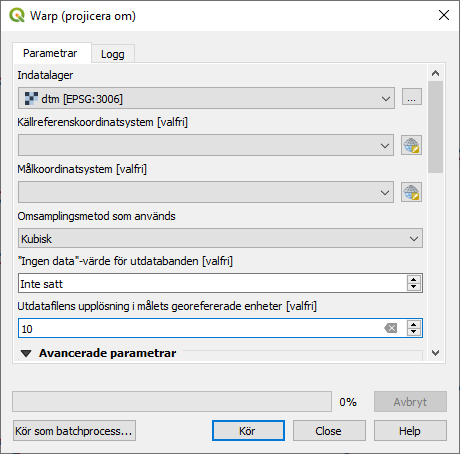
- Raster> Projections> Warp.
- Then select the correct input layer, a suitable resampling method, and specify the desired resolution of the result. In this case, a resolution of 5 or 10 m may be appropriate.
- Press Run to calculate and add as a new temporary map layer named Reprojected.
Create the height curves
From the new coarser height model, the height curves can now be created.
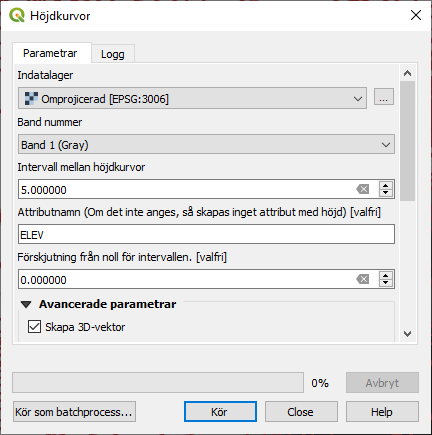
- Select Raster > Extract> Height curves …
- Select the correct input layer, desired interval (equidistance) between elevation curves and, if necessary, select the Create 3D vector check box.
- Press Run to calculate and add as a new temporary map layer with the name Elevation Curves.
Visualize the elevation curves
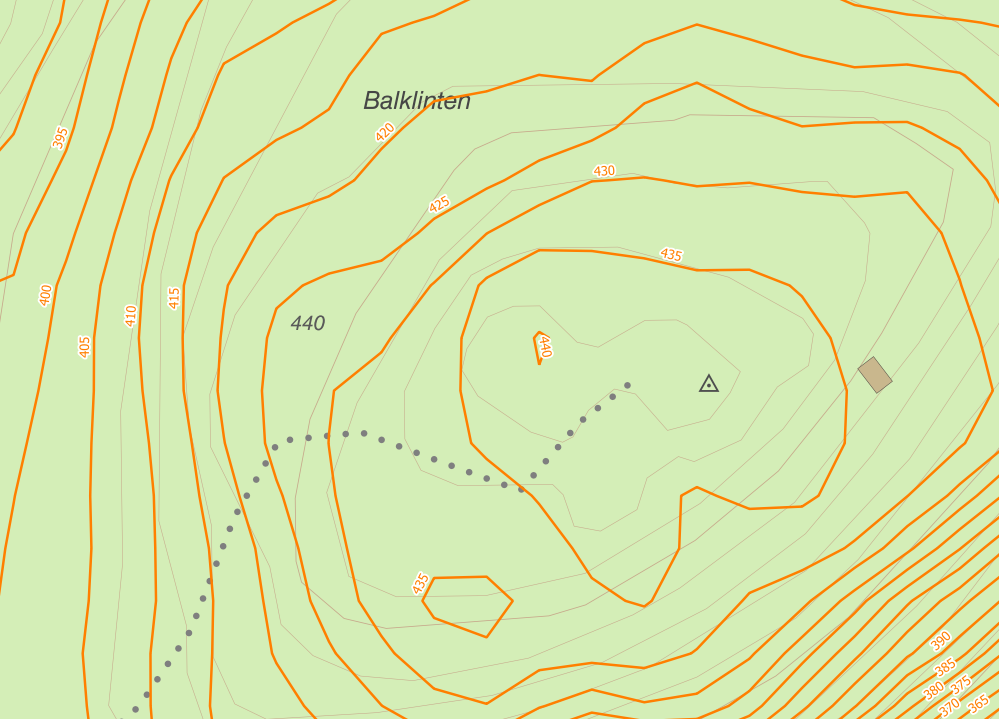
Visualize the new elevation curves by setting an appropriate color and thickness for the lines. If necessary, create curves from the original height model with full resolution for comparison.
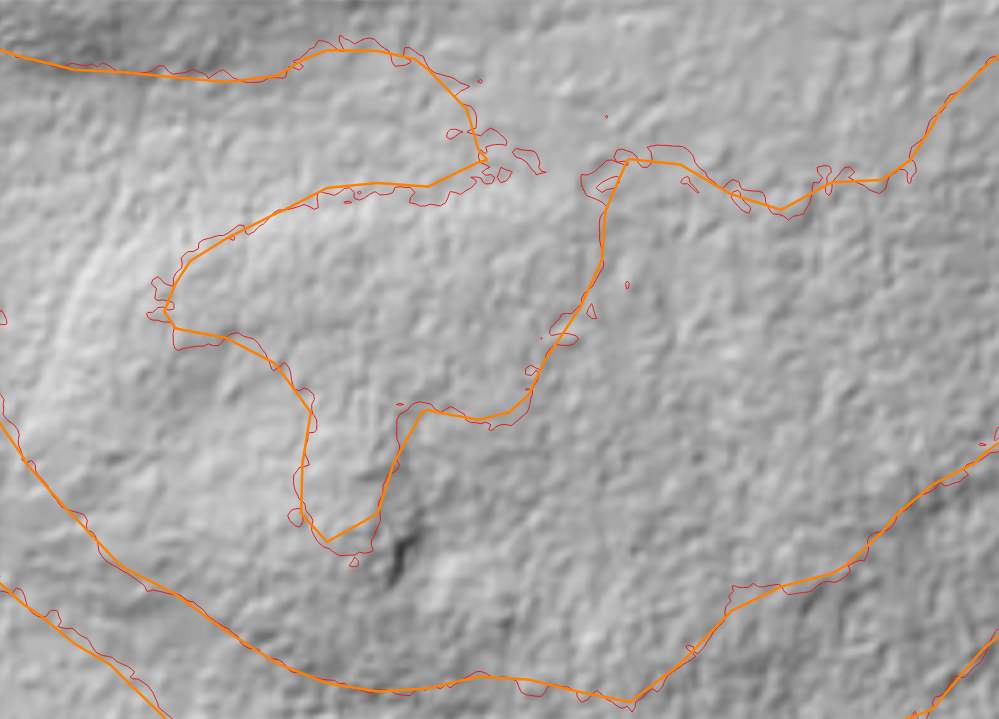
To make the height curves even more attractive, you can possibly remove closed surfaces with a very small area, and even out the curves. Line smoothing functions are missing on the QGIS menu bar, but are in the so-called Toolbox. When you are satisfied with the appearance of the curves, you save them to a file, for example by right-clicking on the map layer and choosing Export> Save As.
If you compare the new elevation curves with existing curves in the Topographic web map, you can see the difference in many places are significant. This is because the existing elevation curves are still based on the old Elevation Database and not on the National Elevation Model.