Geotorget product support
Contents of this page may be automatically translated, we take no responsibility for the accuracy of the translation. Feel free to contact our customer support centre if you have any questions.
The example describes how to load a Surface Model File (LAZ) and Elevation Data from Elevation Model Download and compare the elevation values. The difference is written to a GeoTIFF.
Use fmw files to solve the task
To solve the task, there are two fmw files you can use. The first file brings up the bounding box for the area to be compared and then calls the second file with max / min coordinates as input.
This is what the contents of file number one look like:
File number one: CompareforDMFranYtmodellMedWCSFranHojdmodellDownloadWS1.fmw

This is what the contents of file number two look like:
File number two: CompareforDMFranYtmodelMedWCSFranHojdmodellDownloadWS2.fmw
The reason why there are two files is because we did not come up with a better way to extract WCS heights from Elevation model download with boundingbox coordinates from the surface model file to be checked.
It should be able to fix with for example a FeatureReader but it did not work when we tested it.
Description of the contents of the files
In file number one reads a surface model file (laz) and from it its bounding box is removed.
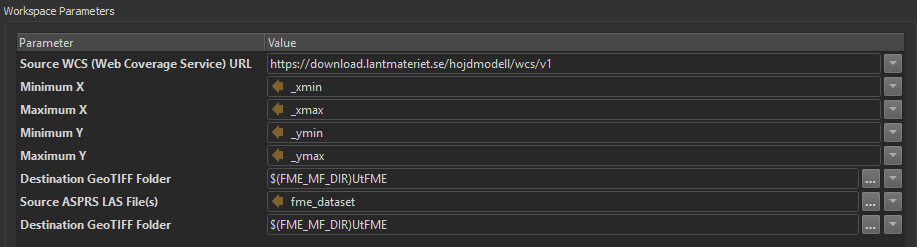
The workspace parameters in the WorkspaceRunner transformer in file number one should be those needed to run file number two, see example in the image below:
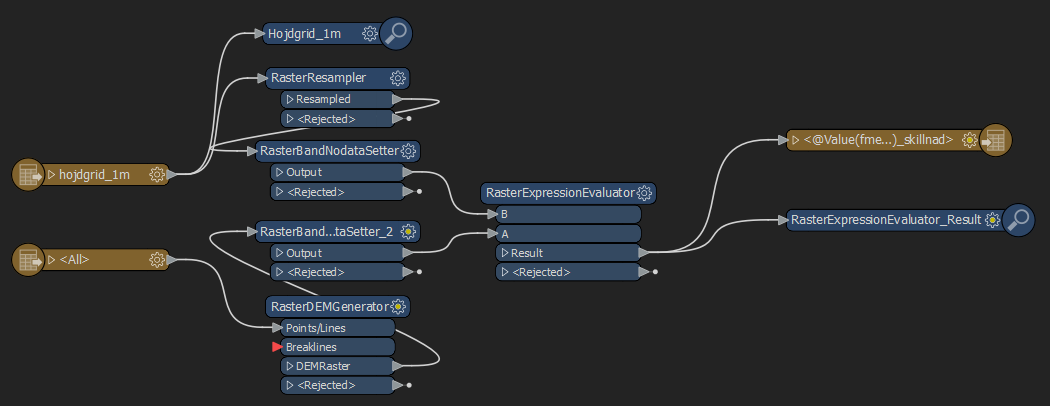
In file number two, a raster DEM is created from the surface model file pss that has been described in document Convert Surface Model FileMedFME.docx. Also read altitude data from Altitude data download pss that you can see examples in the Download height data guide with FME .
The height grid from the WCS is then sampled to get the same resolution as the DEM from the surface model. Then the NoData value is set to - 999 for both data streams, after which the difference between the height data values is calculated by taking the difference between their pixel values.
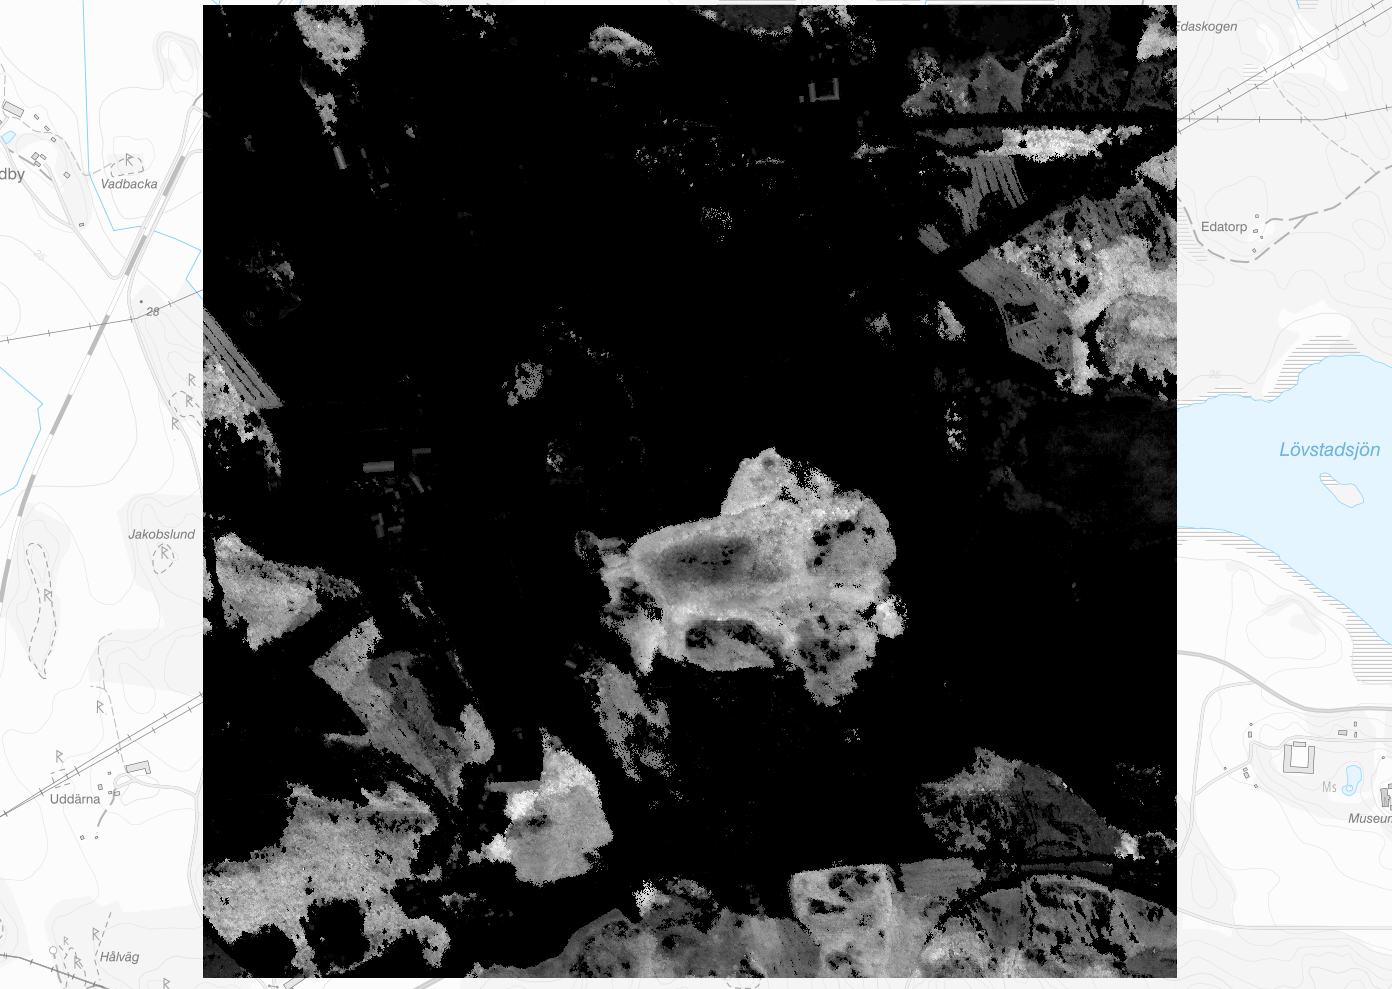
Example of output
The image below shows examples of output. In the difference picture you can see forest areas and buildings because they are very different from the ground level model from Höjddata download: