
 Geotorget product support
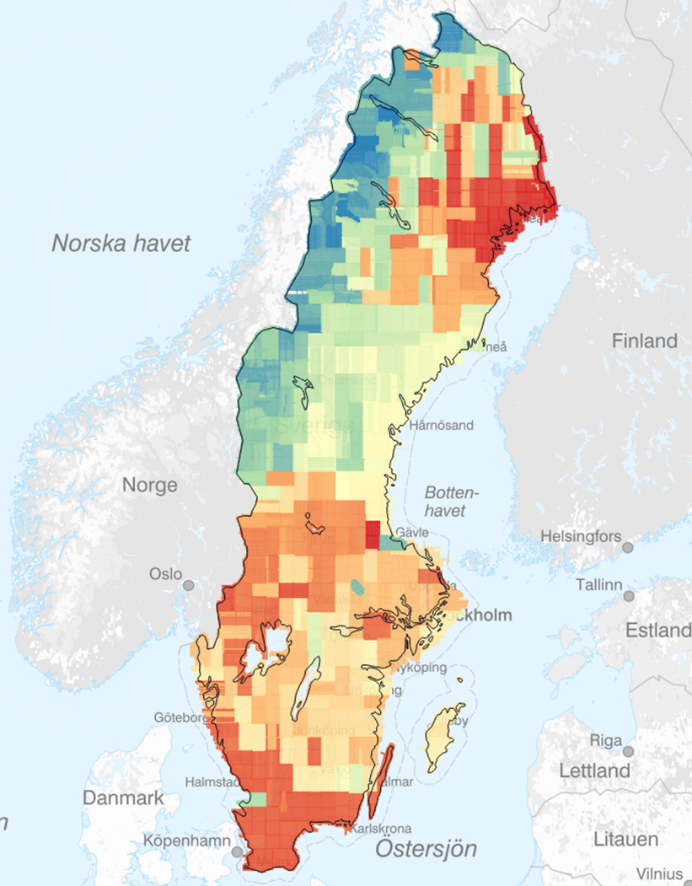
Contents of this page may be automatically translated, we take no responsibility for the accuracy of the translation. Feel free to contact our customer support centre if you have any questions.
11 February 2022
Laser scanning for the construction of the National Altitude Model NH took place between 2009 and 2019. Since 2018, forest laser scanning has been underway that covers the entire country except the mountain range, with a turnaround time of approximately seven years. This is now the main source for updating NH. But outside the coverage area, as well as in the event of major land changes between the surrounding areas, other sources are required.
The only nationwide source for updating NH is the image supply program, which has a significantly shorter turnaround time and whose images can be matched to a high-quality surface model.
However, the benefit of an updated terrain model must be weighed against updating with image data provides a lower quality than laser scanning. Therefore, only major changes should be updated with this technology, and only in areas where forest laser scanning is not imminent.
The nationwide surface model generated from the imaging program data is from 2019 a raster with a resolution of 0.25 or 0.5 meters, which corresponds to approximately half the resolution of the original image.
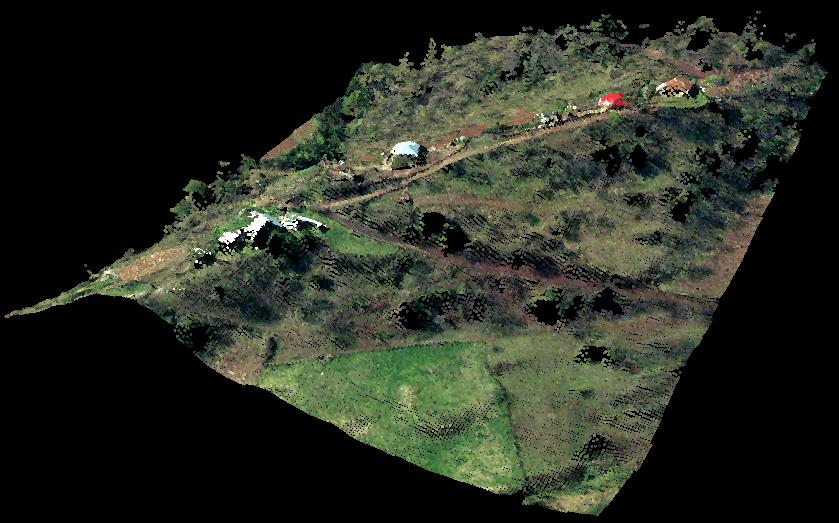
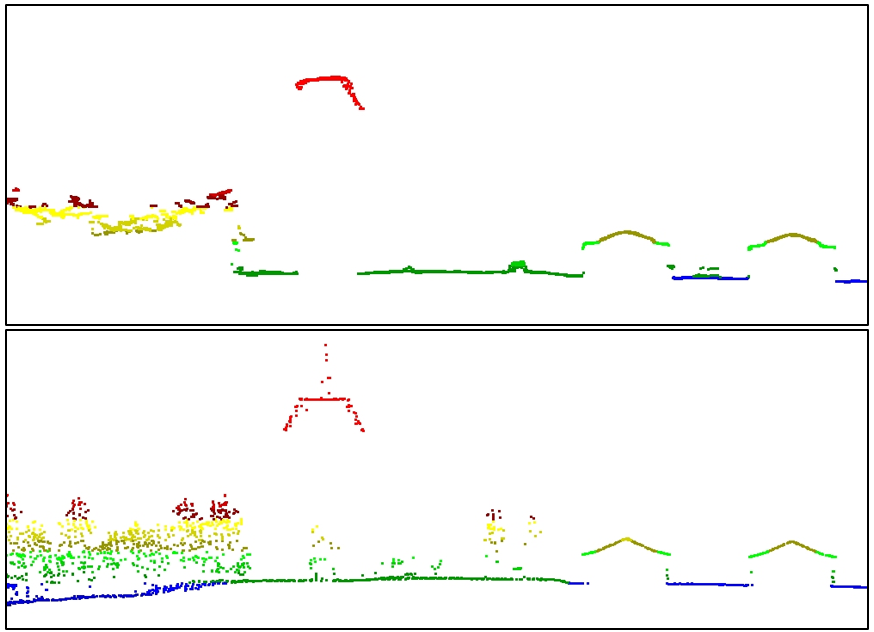
Automatic image matching is used to first generate a point cloud with full resolution. Subsequent filtration and downsampling reduces noise, as well as contradictions and gross errors. The resulting raster is stored as dots in compressed LAS format, where each dot also has color attributes.
There are many similarities between laser data and image data, but also important differences. The most important difference in this context is that only laser scanning is able to image the ground surface under the vegetation.
This makes it relatively easy to classify laser data and filter out vegetation and buildings. For classification and filtering of image data, other methods must be used in part.
Radiometric and geometric information
Of course, image data contains radiometric information in the form of intensity within different spectral bands, but also geometric information in the form of camera parameters and the position and orientation of each image. In the past, analyzes were mainly based on radiometric information, but with new algorithms and powerful computers, the geometric information has also become easily accessible for analysis.
The radiometric information is strongly influenced by which camera is used, and at which season and time of day that the photography is done. By working with differences or ratios between spectral bands, one can to some extent normalize the radiometric information, and for example NDVI can often give a good idea of the distribution of vegetation. But it is still difficult to compare images from different cameras and times.
The geometric information is many times easier to compare because it is less affected by camera and time. Surface models from two photo occasions can be easily subtracted and then show directly which height changes have taken place. The problem will instead be to focus on the changes that are relevant to the national height model, and ignore, for example, forest growth.
Calculation of texture
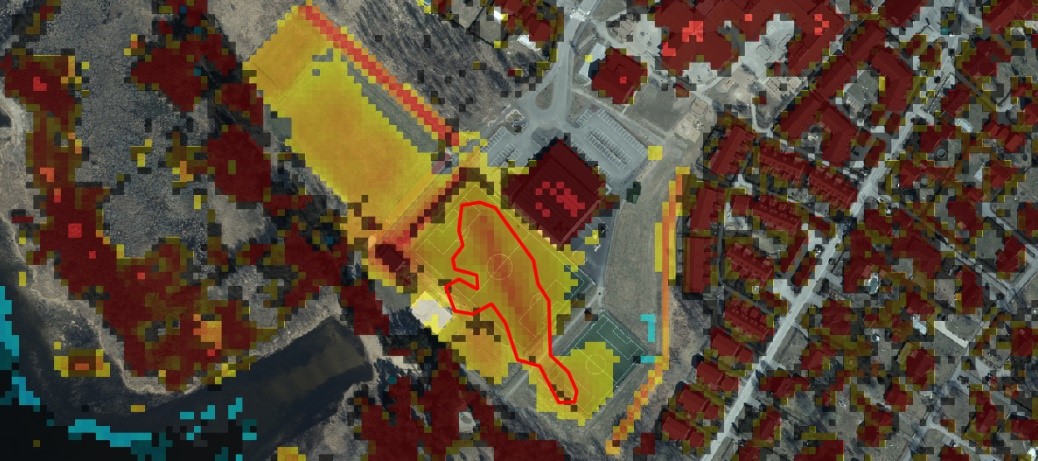
The method for detecting changes is based on analysis of the texture and color information of the surface model (vegetation index NDVI). Using this information, a mask is created that is used to exclude changes that are unlikely to represent soil.
The texture of the surface model can be calculated in different ways. In this case, the model is divided into cells, and for each cell, the equation for the plane that best matches the irregular surface is calculated. The least squares method is used for the calculation, and the standard deviation for the residuals then becomes a measure of the texture of the surface. When change detection for NH, a resolution of 5 meters is used, which provides a sufficient degree of detail and easily manageable amounts of data. It also gives high significance for the calculated texture, as the standard deviation will normally be based on at least 100 residuals per cell.
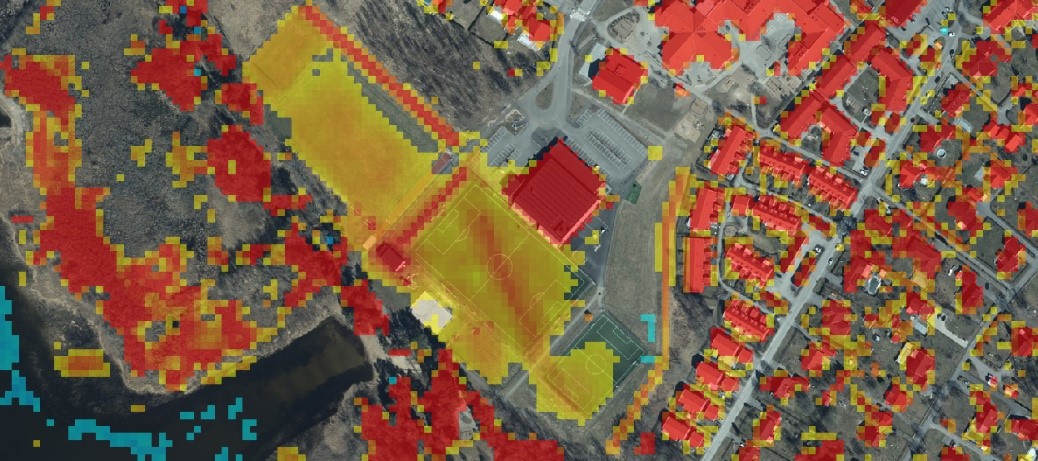
The result will be a raster where each cell has a value corresponding to the texture of the underlying surface model. In a visualization, one sees directly the connection between high texture and vegetation. But you also see that buildings get high texture along the facades. This is because the alignment of the plane gives large residuals when the same cell contains elevation values both on the ground and on the roof.
Filtration and use of color index
Unfortunately, it is not possible to directly identify vegetation from it actual texture image. Namely, there are many types of vegetation that have a relatively smooth surface, and which thus have a low actual texture. This applies above all to certain plantations and shrubs, but also to individual treetops. Of course, roofs also have a low texture. The texture image must therefore be processed so that at least the majority of these cells can be associated with vegetation or buildings.
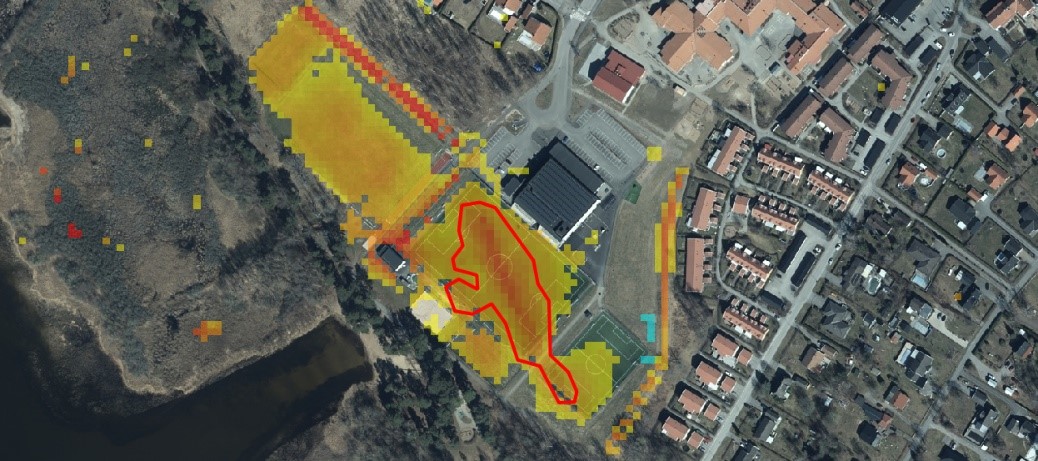
In this case, a filter is used that for each cell adjusts the actual texture based on the relationship to adjacent cells. A window with size 3 × 3 cells is allowed to move over the texture image, and for each position the difference in height and color index between the center cell and each adjacent cell is calculated. NDVI is normally used as the color index.
For each window, a weight function is then applied that assigns the center cell a higher texture if it is likely to represent vegetation or building. In general, the texture of the center cell is often raised if it has a much higher height, or has approximately the same height or color index, as one or more adjacent high-texture cells. The result is that small surfaces on smooth vegetation or roofs have a raised texture, while open surfaces retain a low texture.
To further strengthen the identification of vegetation, a weighting of the surface model's texture and color index is done. If NDVI is above 0.2, it is rescaled to a linearly increasing weight function and multiplied by the texture. This means that many areas with relatively smooth vegetation have a higher texture.
Selection and vectorization
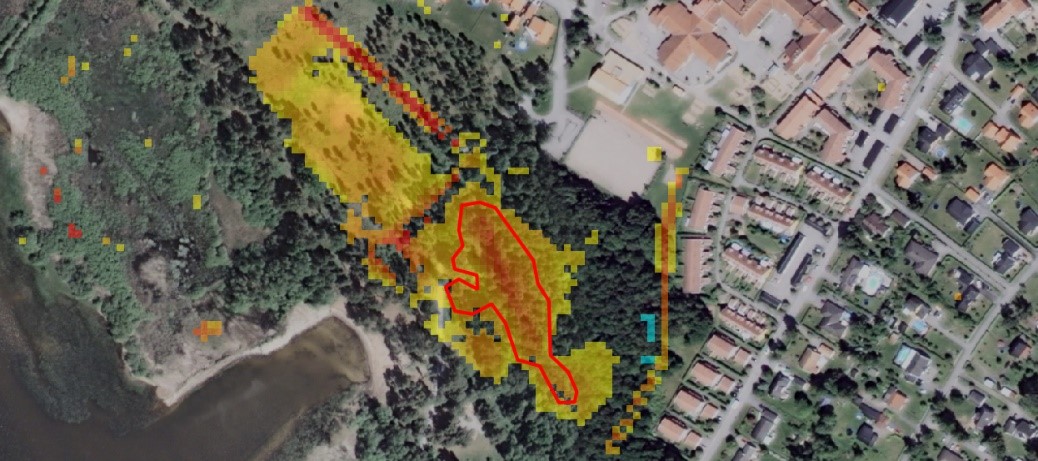
The filtered, and color-indexed texture image can then be easily converted into a texture / vegetation mask by division at a threshold value. At 5 m resolution, a suitable threshold value is approximately 0.2 m. Below the threshold there is then open ground and above the threshold there is mainly vegetation and buildings.
Through a simple overlay between the old terrain model (NH), the new surface model, and the processed texture image, areas with altered soil can be identified. In this case, cells with a height difference of more than 1 m and a texture below 0.2 m are considered to be significant soil changes. To further limit the selection, existing map data from Lantmäteriet 's database with basic geographical data (GGD) is used. Cells located within existing polygons for buildings and water are completely ignored.
Next, nearby cells are aggregated and vectorized into polygons. If the area is at least 5000 m², they go on to the next step.
Manual assessment
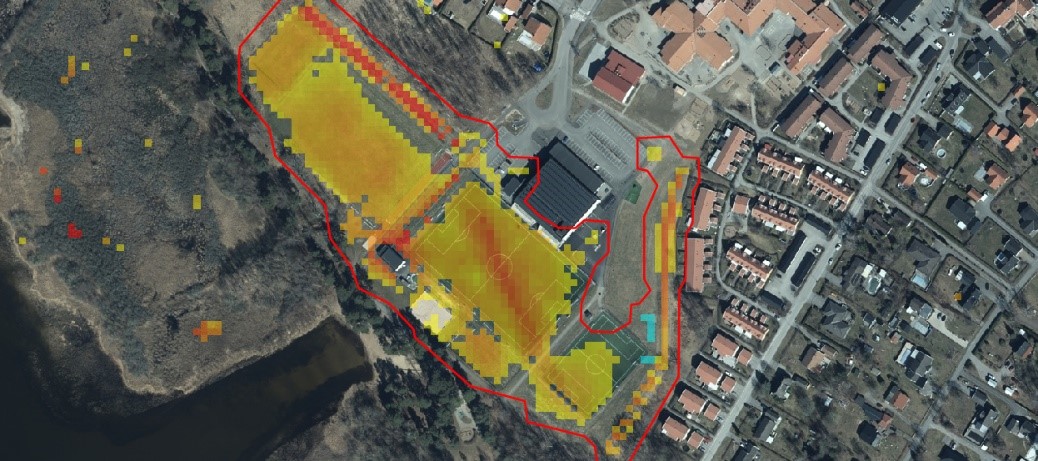
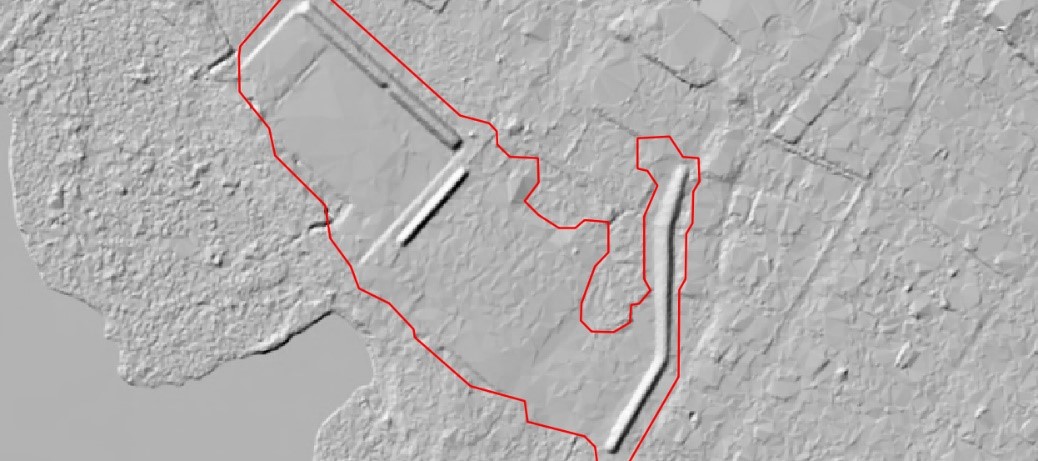
The result from the change detection is thus polygons that indicate probable major ground changes. A large part of these, however, are false hits on smooth vegetation, which despite filtering and balancing with NDVI has maintained a low texture. Examples of two common mistakes are fields with high-growing crops such as rapeseed, and dense stands of reeds. A manual assessment is therefore needed to determine whether an indicated change is true or false.
New orthophotos produced from the same image data as the surface model, in combination with older orthophotos from approximately the time when the original laser scanning for NH was performed. In addition, a difference image, which in a suitable color scale shows the difference in height between the surface model and NH. It is important for the operator to keep in mind that the actual land change is often greater than the automatically demarcated one, as only the part of the change that caused a large height difference is indicated.
All actual land changes are then assessed on the basis of specific criteria with regard to proximity to buildings, infrastructure and water in combination with the area of the change. All changes are assessed equally, regardless of whether they are ongoing (eg road construction) or completed. Areas that are constantly changing (eg quarries) are normally ignored, unless the outer boundary has been changed (extended).
The land changes that meet the criteria then continue in the process, which ends with elevation information from image data in selected areas replaces older height information in NH. The older information is often based on laser scanning with low geometric uncertainty, but it is out of date and therefore not worth preserving.