
 Geotorget product support
Contents of this page may be automatically translated, we take no responsibility for the accuracy of the translation. Feel free to contact our customer support centre if you have any questions.
11 February 2022
Artificial intelligence is a hot topic. More and more industries are starting to find how it can be used. Here we tell you a little about the work we have done to identify buildings with Machine Learning (ML).
It sounds great, but really it's pretty simple. You create a function and gradually improve the parameters in it by seeing how well it works on different examples. Which function should you choose? There are lots of reports and implementations online that you can choose from. Different functions are good at different things and there are evaluations that show which ones are best for a certain type of task. Functions often consist of a neural network and are called models.
The task
The purpose of our task has been to adopt the technology and show that it is good for our geographical information. For that, we have chosen to identify changes to buildings so that we can update the map faster. However, we chose to use ML only to identify buildings and their distribution. We made the change detection itself more traditional.
Input data
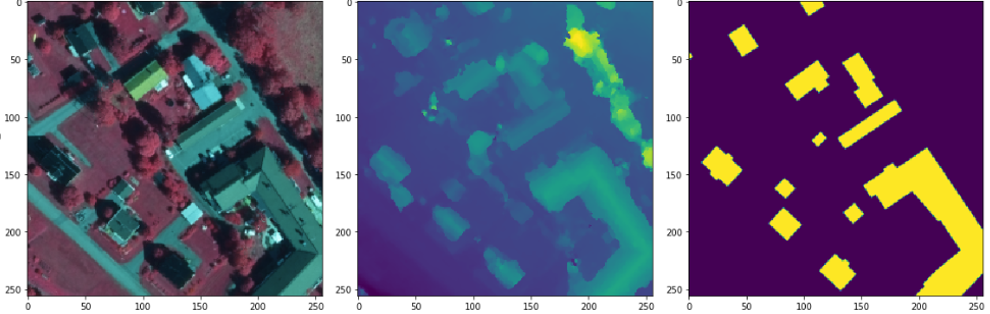
In order to improve a function and also to be able to evaluate it, data / information is needed. We have lots that are well suited for machine learning. To identify houses, we have chosen to use our surface model. The surface model is 3D dots with colors that are produced automatically from our aerial images. What is extra good about the surface model is that everything has a position and then it is easy to compare with other things.
The surface model is a bit awkward in its original form, dots with colors in laz files, but to do easy and fast to use, we have converted to two raster files:
- true orthophoto , where the roofs are in their proper place.
- height data which corresponds to what is at the top, e.g. taken
We also need information about what we want to find, ie buildings that are in our map databases. This data is used for training / optimization of the model / function and also evaluation. Examples of data can be seen in the image below.
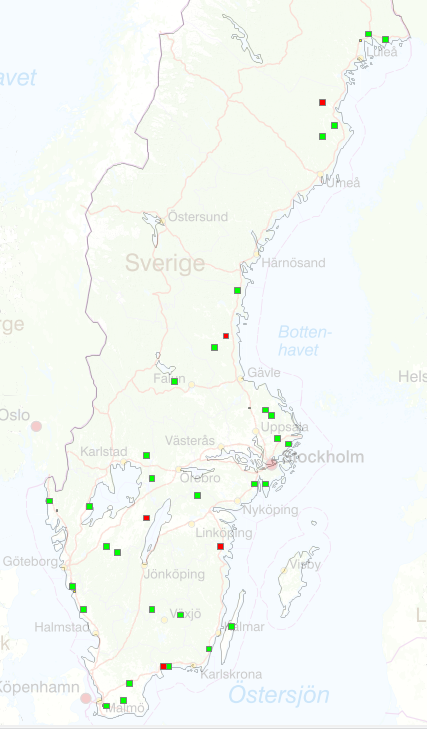
We produce map data mainly in the countryside and have therefore chosen 30 training areas that are 10x10 km2 spread in the countryside. We have also chosen 5 2.5x2.5 km2 areas for verification while we train. It is good to evaluate while training is ongoing so that the training does not specialize too much in training data.
For the correct / independent evaluation, we have chosen 5 10x10 km areas. The image below shows the areas.
Model / function and training
We wanted to use things others have done that would be good for our task. Therefore, we looked around and found both evaluations and implementations. Much of ML is open so it's easy to get started.
We tested several models and implementations on our data. PyTorch (new window) is the framework we used the most, although it has also been Keras (new window) and TensorFlow (new window) . The following are some variants of implementations and models we are stuck for (incl. Links):
The models take small image sections and it may be a little different what is appropriate, but between 200-500 pixels is common to use. Part of the work is to produce a lot of sections. Since we have chosen rural areas where there are not so many buildings, we have also filtered out sections with buildings in them so that the models can more quickly learn what we are interested in, but of course other sections are also needed for training for best results.
Results
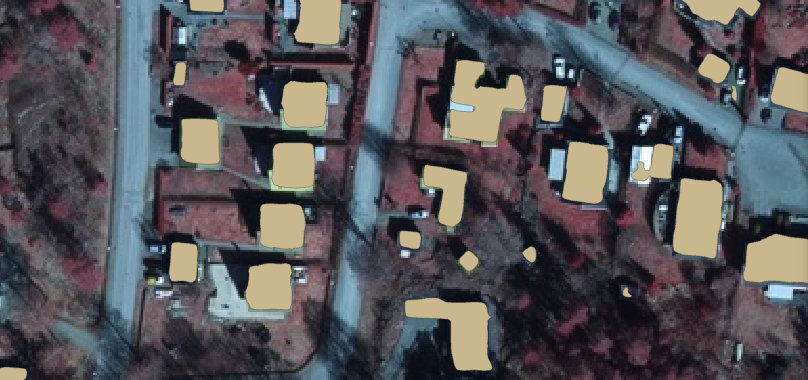
Evaluating results is also an important part of ML and it can be done in many ways. During the learning, the evaluation has been done pixel by pixel, but to understand if it is useful, we have made measurements based on buildings. By comparing the proportion of common area between map data and results from the model, we have identified whether buildings have been found or not (IoU intersection over Union). Two important measures are:
- Recall - what percentage of real buildings have we found
- Precision - If the model flags that it is a building, how often is that true.
In order for us to be satisfied, we want a good recall so that we have good quality. At the same time, we do not want poor precision. If precision is poor, there will be many errors that must be removed.
We have reached up to about 95% both for recall and precision for finding buildings, which is very good. However, we have worse values when we want to find changes because then surface accuracy is important to be able to point to change. Even small buildings can be difficult.
For our example, Unet together with a Resnet50 was the one that gave the best hits together with the best surface accuracy. Deeplab v3 + gave the highest percentage of buildings found.
The future
We have used the surface model with a resolution of 0.5 meters / pixel, but for 2019 we have improved the surface model to 0.25 m / pixel. We believe this will improve the surface accuracy at ML and also find small buildings, but we are waiting for more data to be able to test it. We created a complicated "traditional" process to identify changes. Difficult tasks are well suited for ML and we also believe in solving this with ML.
Then there are other methods that work more as a process than just a function / model. This allows the computer to map like a human, one corner at a time. These types of solutions can be used for many different types of tasks.
We have shown that it is possible to get started with ML without having a long education in the field and that there is a lot of openness online, so now we wonder: What will you do with ML and our geodata?